 |
Molecular and Cellular Modeling
|
|
TASSFUN: Target-specific scoring functions |
|
|
|
 |
|
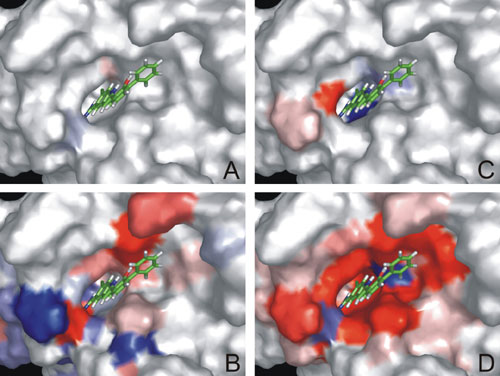
Visualization of interaction energy terms. Electrostatic (A, B) and van der Waals (C, D) interaction values
between a receptor model and one of the compounds in the training set were mapped onto the receptor
binding site surface (in red stabilizing and in blue destabilizing regions for complex formation). The upper
panel (A, C) shows the unweighted interaction energy terms and the lower panel (B, D) the corresponding
ones, weighted by the COMBINE model. It can be seen that not all of the interaction energies have the same
impact on the binding affinity.
Wade, R.C., Henrich, S. and Wang, T. (2004) Using 3D protein structures to derive 3D-QSARs, Drug
Discovery Today: Technologies, 1, 241-246.
 http://www.eml-r.villa-bosch.de/english/research/mcm/index6.php
|
|
|
|
|
 |
|
webmaster |