Abbreviations
MD ... molecular dynamicsREMD ... random expulsion molecular dynamics
P450cam ... cytochrome P450cam
P450BM-3 ... cytochrome P450BM-3
pw ... pathway
traj ... trajectory
CAM ... R-camphor
CAL ... endo-borneol allyl ether
5OH-CAM ... 5-exo-hydroxy-camphor
PAM ... palmitoleic acid
rms ... root mean square
Cytochrome P450cam (P450cam) from Pseudomonas putida has long provided a paradigm for structural understanding of cytochrome P450s, a ubiquitous protein family with functions including the synthesis and degradation of physiologically important compounds, e.g. steroids and prostaglandins, and of many xenobiotics, e.g. drugs and procarcinogens. The mechanism by which camphor, the natural substrate of P450cam, accesses the buried active site is not clear. While there is recent crystallographic and simulation evidence for opening of a substrate access channel in cytochrome P450BM-3 (P450BM-3), for P450cam such conformational changes upon substrate access have not been observed either in different crystal structures or by standard molecular dynamics simulations. We therefore developed a new simulation technique, the random expulsion molecular dynamics method, for probing ligand exit from buried active sites by imposing an artificial randomly oriented force on the ligand in addition to the standard molecular dynamics force field (Lüdemann, S. K., Lounnas, V. and Wade, R. C., J. Mol. Biol., 303, 797-811, 2000). In the present paper, representative animations for the three exit pathways obtained by the random expulsion molecular dynamics method are shown. The method was tested in simulations of the substrate-bound structure of P450BM-3, for which an animation is also shown. The protein dynamics involved in specific substrate exit mechanisms, in particular the transient fluctuations and perturbation of salt-links can be inspected directly in an animation and thus give much better insight into possible access/exit mechanisms than static figures. In addition, center of mass traces of the substrates along different expulsion pathways in P450cam can be examined interactively using MolSurfer, a java-based protein structure viewer originally employed for navigating molecular interfaces (Gabdoulline, R. R., Wade, R. C. and Walther, D., Trends Biochem. Sci 24, 285-7 (1999)). In the present paper, this tool is applied for navigating along the ligand exit pathways in cytochrome P450cam, thereby permitting interactive viewing of the local protein environment simultaneously with precomputed dynamic parameters from molecular dynamics simulations and experimentally determined crystallographic temperature factors.
Introduction
Cytochrome P450 enzymes are hemoprotein monooxygenases that play a critical role in the synthesis and degradation of many physiologically important compounds and xenobiotics (see reviews in FASEB 1992 and 1996). The bacterial cytochrome P450cam (P450cam) from Pseudomonas putida catalyses the hydroxylation of camphor and is extensively characterized by biochemical and biophysical techniques. It thus serves as a prototype for P450 structure-function studies. Several high resolution crystal structures of P450cam without or with substrate or inhibitor bound to the active site have been solved. 1, 2, 3. These structures indicate two regions where possible access or exit channels to or from the completely buried active site could be located, but as shown in fig.1, the inner active site and the outer molecular surface are not connected to each other. Consequently, the protein must undergo transient conformational changes to allow for substrate access and product exit.
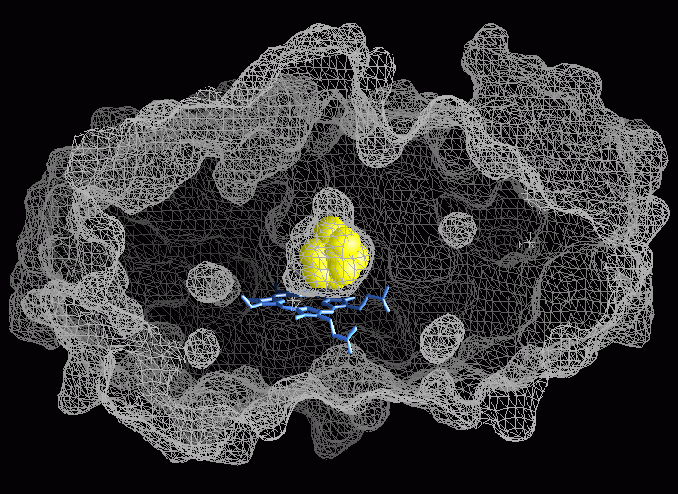
Fig.1: The inner active site surface and the outer molecular surface computed by the GRASP program 4 using a probe radius of 1.4Å are shown. They are not connected to each other and therefore, no substrate access or product egress channel can be seen.
In the following paragraph, the colors used for residues or secondary structure elements in the text correspond to the color code used in fig.2.
Examination of the crystal structure 2, 5 prompted speculation about a possible entry channel located between the B' helix and the F/G loop (see Fig. 2, below). This is supported by the following data: (i) Site-directed mutagenesis and stopped flow kinetic measurements that show that Tyr29 (N-terminus) and Phe193 (F/G loop) have an important influence on substrate access 6. (ii) The crystal structure of P450cam with a large inhibitor bound that shows that this inhibitor which is larger than the natural substrate occupies part of the putative access channel. In this structure the sidechains of residues Phe87, Tyr96 and Phe193 are displaced with respect to the sidechains in the camphor bound structure 1. Recently, the structure of an (artifically large) ruthenium sensitizer-linked substrate was solved and showed the ligand extending along and opening up the putative access channel 7 . (iii) In the crystal structures of two structurally similar proteins of the P450 family, cytochrome P450BM-3 8 and nitric oxide reductase 9, in which this channel is open.

Fig.2: Overview of specific secondary structure elements and residues in P450cam.
Adjacent to the proposed substrate entrance channel, there is a ring of four salt links formed by the residues, Asp251, Lys178, Arg186, and Asp182. Experiments indicate that substrate access to the active site of P450cam is modulated by electrostatic interactions involving residue Asp251 10. This salt-link tetrad and a further salt-link between Asp97 and Lys197 are amongst the most electrostatically stable salt bridges in P450cam 11. The combined action of the salt-link tetrad and the salt-link Asp97-Lys197 could be important for the tethering of the F/G helix+loop to the I helix and the B' helix in order to keep the substrate access channel closed. Such a tethering mechanism might be important for sufficient desolvation of the buried active site upon substrate binding and consequently for catalysis.
In order to investigate possible ligand exit channels from the active
site, a novel method, random expulsion molecular dynamics, was developed
12.
During molecular dynamics simulations,
a randomly oriented additional force is imposed on the ligand
in addition to the standard molecular dynamics force field.
In a set of over 20 simulations of ligand egress
from P450cam, three classes of exit pathways
were observed.
One of these pathways is
the proposed substrate access channel.
By applying steered molecular dynamics and adiabatic mapping techniques,
this channel was found to be the most probable pathway 13.
Here, we present animations of representative trajectories and a new
interactive trajectory visualization tool.These facilitate
investigation of the transient conformational changes involved in ligand
exit during the simulations. For interactive visualization, we
have adapted our
MolSurfer software (see also Methods)
to enable investigation of the
trace of the center of mass of the ligand along its exit pathway.
MolSurfer was originally designed to aid visualization of macromolecular
interfaces by linking 2D-projections of the properties of the interfaces
to the 3D-structures. The 3D-structures are displayed with the
Java macromolecular viewer,
WebMol 14.
In this paper, the
ligand
trajectory is displayed by a tube through the
protein structure (in the WebMol window). Navigation of the tube is
coupled to a second window (the MolSurfer window) which permits
simultaneous display of trajectory properties such as the simulation
time in ps, the residues closest to the ligand trajectory, and computed
and crystallographic thermal factors.
The force constants of the expulsion trajectories shown in the present
paper range from 500-1000 kJ/mol*nm. Concomitantly, values of rmin
between 0.001 and 0.016Å together with N of 10-80 have been
chosen.
Initial cartesian coordinates of P450cam with camphor bound and P450BM-3
with palmitoleic acid bound were taken from the Brookhaven
protein data bank (entries 2cpp
and 1fag,
respectively).
Simulations were performed with the ARGOS MD program 15
using the CHARMm 22 16
all atom force field. Parametrization, set up and simulation details
are described elsewhere 11,
12.
If you want to switch between the representation of all pathways at
once and only one single pathway, click on "File", "Open" in
the
MolSurfer window and choose the representation you are interested in.
Use menu View to switch between the properties to be displayed on the 2D map.
The colour of the tube can be changed with the MeshColor button
in the MolSurfer
window.
To adjust the range for displaying properties on 2D map, click left/right mouse button on the color bar.
Use menu File--Quit when done.
Due to the high compression and the non-standard size of our mpeg movies,
some mpeg players (in particular those commonly installed in the internet
explorer) cannot play our movies.
Look at the quicktime movies instead. It is important to
note that some of the quicktime movies are lower
quality as they have been obtained by conversion from mpeg.
In P450BM-3, a pathway similar to pw2a in P450cam
was found
together with a further pathway subclass 2d 12,
for which no animation is shown in the present paper.
Animations can be obtained when clicking on the left icons which show the
center of mass traces of the ligand along a single representive trajectory for each
pathway class.
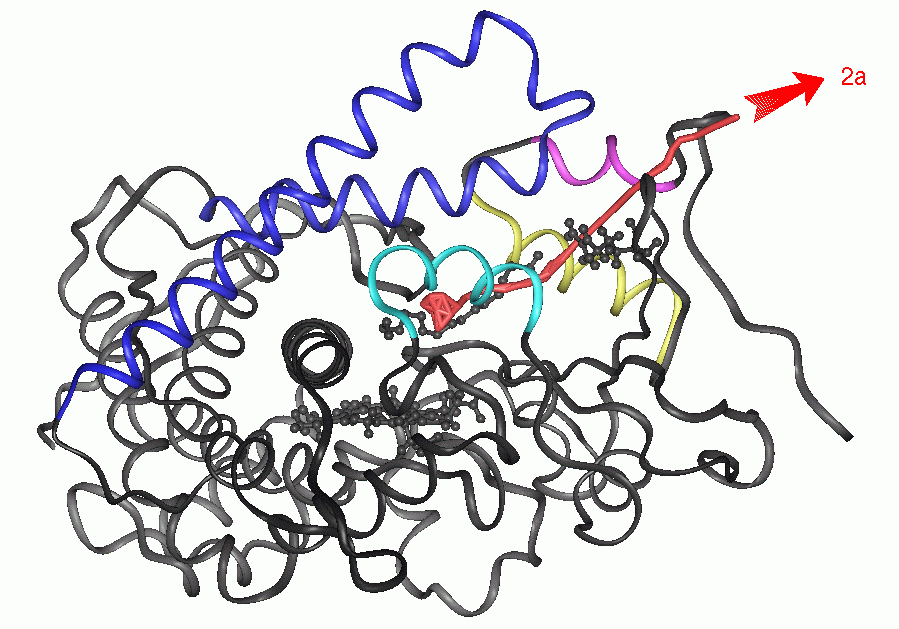
Animation 1 (3.3Mb):
Pathway 2a for exit of PAM from P450BM-3 (traj#1).
The red line shows the center of mass of the ligand. Secondary structure
elements that undergo significant conformational changes during ligand
exit are coloured. The heme, PAM and Arg-47 are shown in ball-and-stick
representation. In the animation (for mpeg format, click on the image to
left to view, for quicktime format click below image),
PAM is shown in yellow, Arg47 is shown in stick
representation in light blue and the heme ring in light grey.
The location of the expulsion pathways observed with the REMD method
(applied on the closed substrate-bound crystal structure) matches with
the location of the open channel seen in the substrate-free crystal structure.
Furthermore, the rms deviations for each residue from the crystal structure
averaged over the expulsion phase are in good agreement with the rms differences
between substrate-free and substrate-bound crystal structure, cf fig.5 in ref
12.
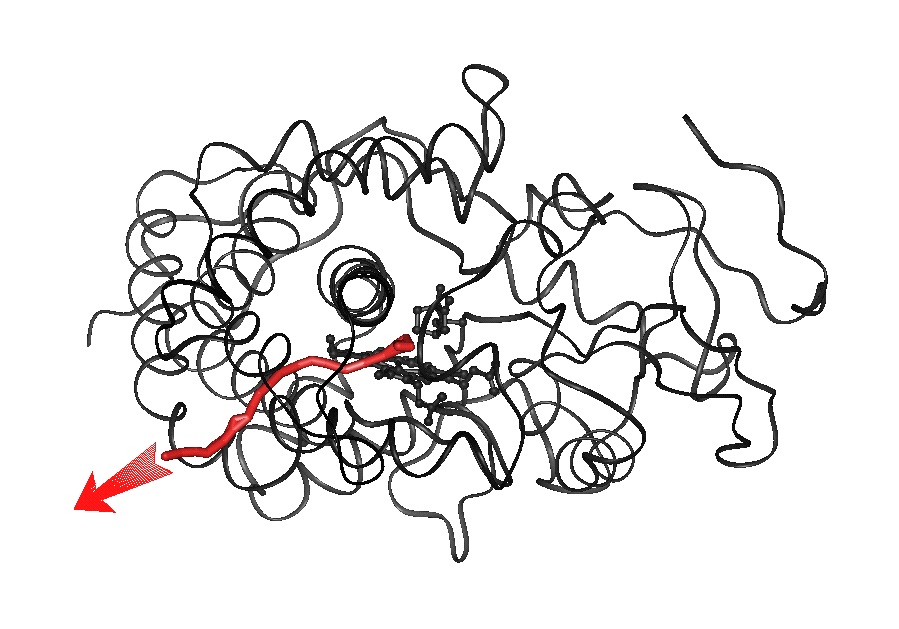
Animation 2 (4.4Mb):
Pathway 1 for exit of CAM from P450cam (traj#2).
The red line shows the center of mass trace of the ligand. In the animation
(for mpeg format, click on the image on the left to view; for quicktime format
click below image), the backbone of
cytochrome P450cam is shown as a ribbon, CAM is shown in
yellow and the heme ring in white.
Start MolSurfer
representation
Key features of the mechanism:
Small backbone
fluctuations are accompanied by rotation
of the aromatic sidechains of residues Tyr29, Phe87, Tyr96, Phe98,
Phe193 and Tyr201. The aromatic sidechains act like doors that are opened
via transitions of the sidechain torsions of
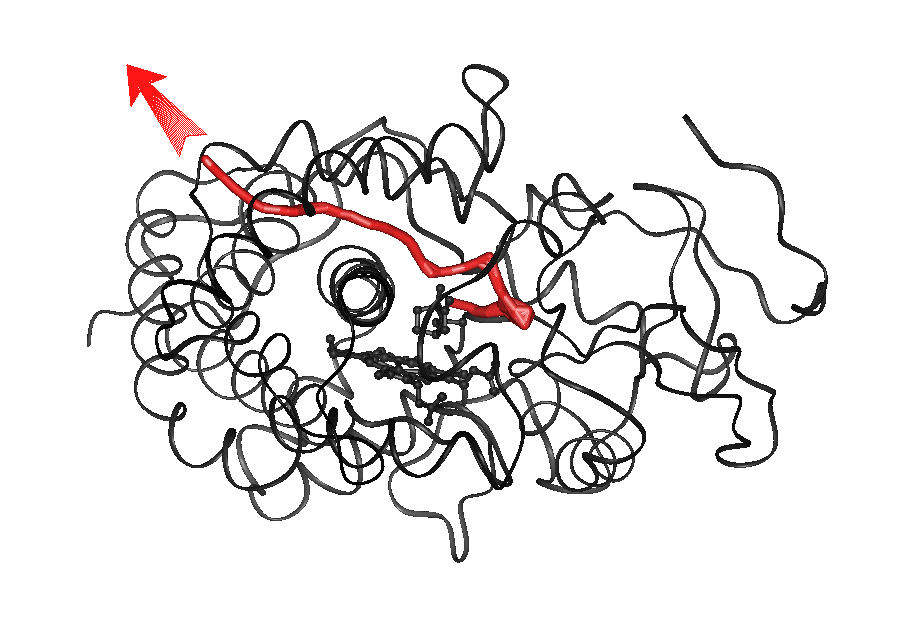
Animation 3a (4.4Mb):
Pathway 2a for exit of CAM from P450cam
(traj#3)
.
The red line shows the center of mass trace of the ligand. In the animation
(mpeg format, click on the image to the left to view click; for quicktime format
click below image), the backbone of
cytochrome P450cam is shown as a ribbon, CAM is shown in yellow, Phe 87
in white, Phe 193 in light blue and Tyr96 in green.
Animation 3b (11.7Mb):
Pathway 2a for exit of CAM from P450cam
(traj#4)
.
In the animation (mpeg format, click on the image to the left to view; for quicktime format click below image),
of this alternative trajectory of pw2a, Phe 29 (shown in red)
and Phe 193 (shown in blue) are displaced upon exit of CAM (shown in yellow).
Animation 3c (18.0Mb):
Pathway 2b for exit of CAM from P450cam (traj#5).
In the animation (mpeg format, click on the image to the left to view; for quicktime format click below image), CAM
is shown in yellow. Pathway 2b is located between the B' helix and the
Animation 3d (2.4Mb):
Pathway 2c for exit of CAM from P450cam (traj#6).
In the animation (mpeg format, click on the image to the left to view; for quicktime format click below image), CAM
is shown in yellow. Exit
involves the displacement of the sidechains of residues Phe98 and Tyr201 (shown
in light blue) and perturbation of the salt-link beween Asp97
and Lys197 (colored atomwise).
Start MolSurfer
representation
Exit MECHANISM:
Animation 4(12.4Mb):
Pathway 3 for exit of CAM from P450cam
(traj#7)
.
The red line shows the center of mass trace of the ligand.
In the animation (mpeg format, click on the image to the left to view; for quicktime format click below image),
the backbone of cytochrome P450cam is shown as a ribbon and CAM is shown in yellow.
CAM tries to exit via pw2a, but then it proceeds
to the region below the F and G helices.
Finally, ligand egress is observed close to the E/F loop.
Start MolSurfer
representation
Perturbation of the salt-links Asp251-Arg186, Asp251-Lys178 or Asp97-Lys197
has been observed in nearly all REMD
trajectories of all pathways. On the other hand, we have found in steered molecular dynamics simulations
13 that the energy barrier for ligand exit
is not affected by neutralising the salt-links.
Most probably, therefore, the salt-links affect the slow frequency dynamics
of P450cam which are of importance for the opening of the substrate access channel
on a much slower time scale than our
expulsion trajectories.
Click here for Animation 5a in
quicktime format (5.9Mb)
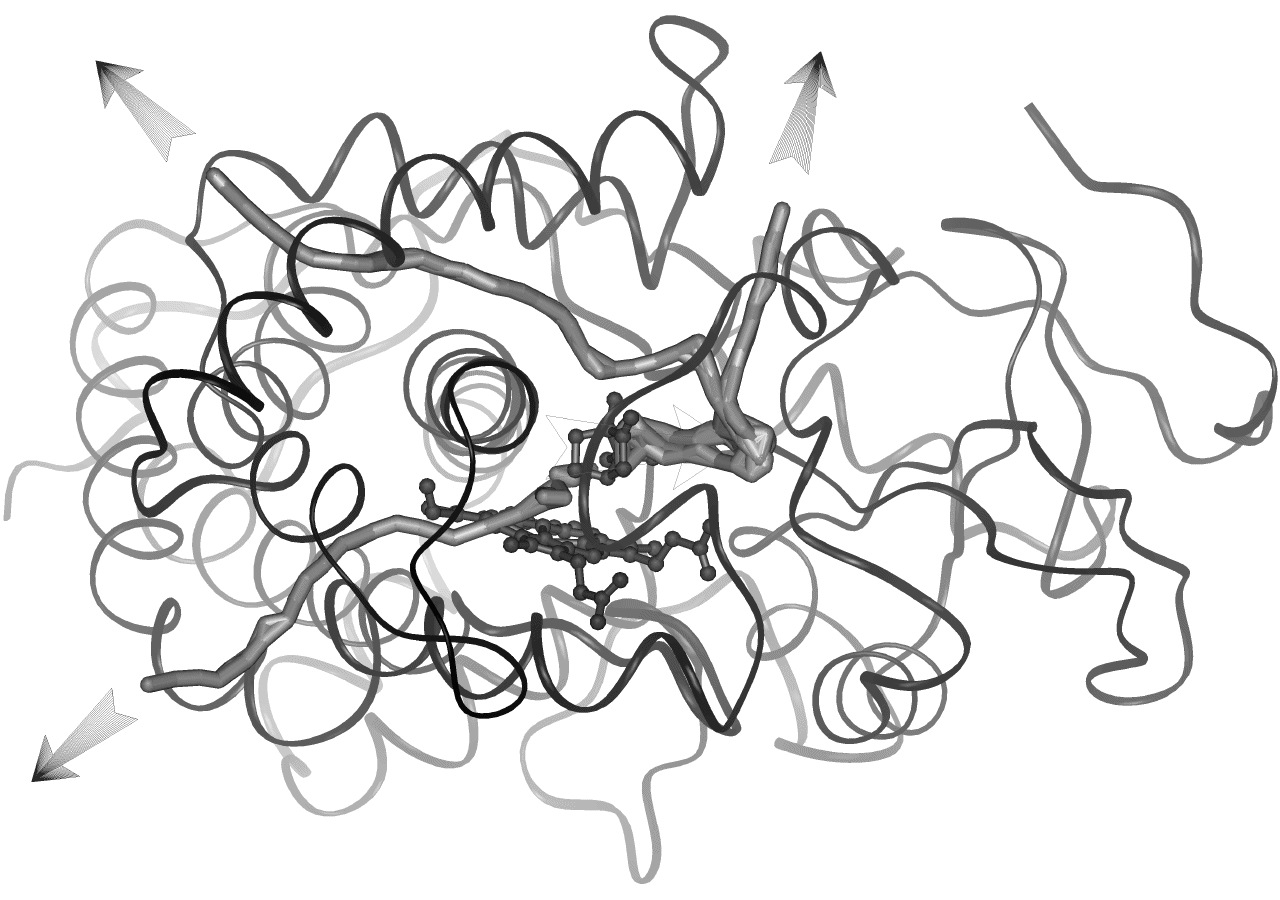
Table2 List of all expulsion trajectories in
P450cam for which a MolSurfer representation is shown. The pathway location,
the pathway classification and the REMD parameters are given. For definition
of rmin,
N and k, cf. Methods.
Methods
1. The random expulsion molecular dynamics
approach (REMD) approach
The time range amenable to MD simulations is generally not sufficient to see spontaneous
substrate access or product exit to or from the buried active site. In order to
enhance the probability of such an event, an artificial force is imposed
on the ligand - which in the starting configuration is in the active site
- in addition to the standard MD force field. The direction of this force
acting on the center of mass of the ligand is chosen randomly. Thus, the force
does not a priori point from the active site to the closest point
on the surface. The direction of the force with the force constant k is
kept for a chosen minimum number of time steps, N. The time step
was 0.2 fs. During the N time steps,
a specified minimum distance, rmin, has to be
covered by the substrate molecule, otherwise a new direction for the force
is chosen. Thus, the substrate probes different regions of the protein
until it finds an exit pathway. For a more detailed description of the method,
see 13.
2. How to use MolSurfer for interactive display of the ligand exit trajectories
Two windows pop up, when MolSurfer is started by clicking on the thumbnail picture.
When you click on a certain value of the above listed quantities in the
MolSurfer
window, the protein in the WebMol window is immediately centered
around it. In order to be able to correlate two quantities at once (e.g.
step number and B-factors) go to the "View Menu", activate the "Add/Remove
Map" button and then click on the buttons of the quantities listed above.
3. How to look at the animations
Animations are given in mpeg and alternatively in quicktime format.
If you use netscape as internet browser, you can install a mpeg player from e.g.
the following web adresses:
http://www.geom.umn.edu/docs/mpeg_play/mpeg_play.html or
http://bmrc.berkeley.edu/frame/research/mpeg/mpeg_play.html.
Set the following Application specification under Netscape - Preferences -
Navigator -Applications:
Description: MPEG Video
MIMEType: video/mpeg
Suffixes: mpeg,mpg,mpe,mpv,vbs,mpegv
Application: "the dir where your local mpeg-player is installed" %s
Results
1. Substrate
exit pathway classification in P450cam and P450BM-3
The ligand trajectories obtained by the REMD
method were clustered into pathway classes.
The clustering was performed by graphical inspection. A pathway class comprises
all trajectories connecting the active site and a particular sector of
the protein surface.
The location of all pathway classes
in P450cam can be viewed interactively using MolSurfer
17.
If within
a pathway class, the ligand trajectory endpoints show further clustering into sub-clusters, pathway
subclasses (denoted by lower case letters) were introduced.
Pathway subclasses were introduced for pathway class 2, i.e. pathway subclasses 2a, 2b and
2c (compare animations
in the section Pathway
class 2).
Subclasses differ from classes in that they share at least one
secondary structure element with the other subclasses in the same class.
For pathway class 2 this is the B' helix in P450cam and the "a" 310
helix in P450BM-3.
2. Application
of the REMD method to P450BM-3
The random expulsion method was tested by applying it to P450BM-3, a
system for which the substrate access channel is closed in the substrate-bound
and open in the substrate-free crystal structure 18,
8.
Expulsion was started from the substrate bound crystal structure.
Exit MECHANISM:
In the bound state, the surface-exposed sidechain
of Arg47 of P450BM-3 forms a salt bridge with the carboxylic group of the
substrate palmitoleic acid (PAM) and helps to orient it in the active site.
During expulsion, this salt bridge is stable,
such that the initially buried aliphatic moiety of PAM is expelled first.
Click here for Animation 1 in
quicktime format (5.8 Mb)
3. Substrate
exit pathways obtained in P450cam
The random expulsion MD simulations method was applied to probe the exit from P450cam
of the following
compounds: camphor (CAM), the natural substrate, 5-hydroxy camphor (5-OH CAM),
the product,
and endo-borneol allyl ether (CAL). The latter, designed to fill the extra
space in the active site unoccupied by CAM, was chosen because it is larger than CAM
19.
21 successful REMD simulations were obtained
12.
Here,
7 representative animations for the exit of CAM and CAL from P450cam are shown.
3.a Pathway class 1
Pw1 is unique in that it is located in the proximal part of P450cam (protein
part below the heme ring in the orientation shown throughout the present
paper). This is the side from which the reductant putidaredoxin binds under
physiological conditions 20.
The endpoints of the expulsion trajectories
are located between the C and H ![]() -helices
or close to C' helix, G/H loop and
-helices
or close to C' helix, G/H loop and ![]() sheet.
sheet.
Exit MECHANISM:
The ligand has to pass a region with little flexibility (heme ring), before the exit
occurs at a region with high flexibility (C' helix) predominantly populated by small aliphatic
amino acids (Val, Ala and Leu). Upon ligand exit the heme plane is transiently forced into a strained
conformation that deviates from planarity. Of all pathways, it shows the largest backbone
deformation upon ligand egress (local C![]() rms fluctuations of 2.4-3.9Å in the C' helix).
rms fluctuations of 2.4-3.9Å in the C' helix).
Click here for Animation 2 in
quicktime format (13.2 Mb)
(by clicking on the picture)
3.b Pathway class 2
Pw2 consists of 3 different pathway subclasses 2a-2c in P450cam, the endpoints
of which lie up to 15Å apart from each other on the protein surface.
This class shows the lowest global rms deviations (1.2-1.7Å) and the smallest
C![]() rms fluctuations (0.9-1.8Å).
rms fluctuations (0.9-1.8Å).
![]() and
and ![]() .
Thus, small fluctuations (below 2.4Å) suffice to allow CAM (with a diameter of
approximately 6.5Å) to exit. Pw2c, additionally, requires the perturbation of the
salt-links between D97 and K197.
.
Thus, small fluctuations (below 2.4Å) suffice to allow CAM (with a diameter of
approximately 6.5Å) to exit. Pw2c, additionally, requires the perturbation of the
salt-links between D97 and K197.
Click here for Animation 3a in
quicktime format (14.3Mb)
Click here for Animation 3b in
quicktime format (9.5Mb)
![]() and
and ![]() sheets. This pathway was only observed once and
with a higher expulsion force constant.
Therefore, it is considered to be a lower probability pathway.
From the animation one can see that CAM is blocked for about 30ps at the same position
in proximity to the
sheets. This pathway was only observed once and
with a higher expulsion force constant.
Therefore, it is considered to be a lower probability pathway.
From the animation one can see that CAM is blocked for about 30ps at the same position
in proximity to the ![]() and
and ![]() sheets before it succeeds in exiting the protein.
Click here for Animation 3c in
quicktime format (14.7Mb)
sheets before it succeeds in exiting the protein.
Click here for Animation 3c in
quicktime format (14.7Mb)
Click here for Animation 3d in
quicktime format (2.0Mb)
(by clicking on the picture)
3.c Pathway class 3
In pw3 substrate exit is observed between the F and G helices or at the
E/F loop. This pathway class has the lowest number of occurences and requires
higher force constants (800kJ/mol*nm) acting on CAM.
Ligand exit along this pathway involves the displacement
of backbone and sidechains
of aliphatic residues, e.g. L200, V177 and V247.
Click here for Animation 4 in
quicktime format (20.2Mb)
(by clicking on the picture)
4. The
role of salt-links in substrate exit/access
The combined action of the salt-links Asp251-Arg186,
Asp251-Lys178 and Asp97-Lys197 may modulate opening and closing
of substrate access channels. The first two salt-links tether the F/G flap
to the I helix. The third salt-link connects the B' helix to the G helix.
Such a tethering mechanism could be important for ensuring sufficient
desolvation of the buried active site upon substrate binding and during catalysis.
Furthermore, it could explain why the crystal structure of P450cam is
remarkably robust in the presence of different ligands in the active site,
with only 2 structures with long, elongated compounds bound showing any
significantly different conformation of P450cam
1, 7.
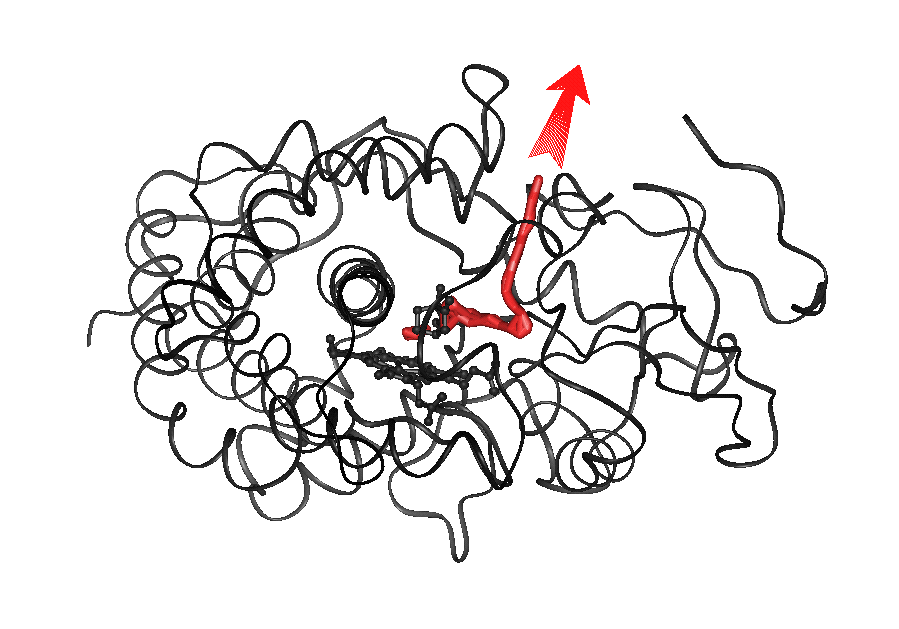 Animation 5.a (7.2Mb):
Pw2a for exit of CAL from P450cam
(traj#8).
In the animation
(mpeg format, click on the image on the left to view; for quicktime format click below image), the backbone of
cytochrome P450cam is shown as a ribbon, CAM is shown in
yellow and the heme ring in white. The residues Asp251, Arg186 and Lys178
forming salt-links are colored by atom. Phe87 is colored in white and
Phe29 in red.
Expulsion of CAL along pw2a and the concomitant perturbation
of salt-links Asp251-Arg186
and Asp251-Lys178 is shown.
Hydrogen bonds formed by the salt-links are
displayed by continuous lines
to make the conformational changes more visible. At the end
of the
animation, the salt-link between Asp251-Lys178 (left bond), although
still shown as a bond, is
broken, while the salt-link between
Asp251-Arg186 (right bond) is reformed again, as the side-
chain
of Asp251 has rotated around
Animation 5.a (7.2Mb):
Pw2a for exit of CAL from P450cam
(traj#8).
In the animation
(mpeg format, click on the image on the left to view; for quicktime format click below image), the backbone of
cytochrome P450cam is shown as a ribbon, CAM is shown in
yellow and the heme ring in white. The residues Asp251, Arg186 and Lys178
forming salt-links are colored by atom. Phe87 is colored in white and
Phe29 in red.
Expulsion of CAL along pw2a and the concomitant perturbation
of salt-links Asp251-Arg186
and Asp251-Lys178 is shown.
Hydrogen bonds formed by the salt-links are
displayed by continuous lines
to make the conformational changes more visible. At the end
of the
animation, the salt-link between Asp251-Lys178 (left bond), although
still shown as a bond, is
broken, while the salt-link between
Asp251-Arg186 (right bond) is reformed again, as the side-
chain
of Asp251 has rotated around![]() by approx. 180o. The perturbations of the salt-links
are triggered by the
by approx. 180o. The perturbations of the salt-links
are triggered by the![]() ,
,![]() rotations
of the aromatic residues Phe87 and Phe29 which cause
a structural relaxation in their proximity.
rotations
of the aromatic residues Phe87 and Phe29 which cause
a structural relaxation in their proximity.

Animation 5.b (2.4Mb):
Pw2c for exit of CAM from P450cam (traj#6).
In the animation
(mpeg format, click on the image on the left to view; for quicktime format click below image),the backbone of
cytochrome P450cam is shown as a ribbon, CAM is shown in
yellow and the heme ring in white. The residues Phe98 and Tyr201
are shown in light blue.
The
perturbation of salt-link Asp97-Lys197
along pw2c is shown. The salt-link is transiently broken
(with a distance
between N![]() and OD1 of 4.5Å.)
This perturbation is triggered by the conformational
changes of the aromatic
residues Phe98 and Tyr201 upon substrate exit.
and OD1 of 4.5Å.)
This perturbation is triggered by the conformational
changes of the aromatic
residues Phe98 and Tyr201 upon substrate exit.
Click here for Animation 5b in
quicktime format (2.0Mb)
5. Overview of expulsion trajectories
Table1 List of all expulsion trajectories in
P450BM-3 and P450cam for which animations are shown. The pathway location,
the pathway classification and the REMD parameters are given. For definition
of rmin,
N and k, cf. Methods.
protein
traj #
pw #
rmin/
N
k/
expulsion
traj.
+
route
length1/
ligand
Å
(kJ/mol
![]() nm)
nm)(residue #)
ps
P450BM-3
PAM
1
2a
0.008
40
1000
B' helix, F/G
~10
P450cam
CAM
2
1
0.004
20
1000
C and H helices
~30
- `` -
3
2a
0.002
10
800
F/G loop,
~20
B' helix (via 87)
- `` -
4
2a
0.016
80
600
- `` - (via 29, 193)
~50
- `` -
5
2b
0.005
10
1000
B/B' loop,
![]() ,
,![]()
~60
- `` -
6
2c
0.008
40
700
B', I and G helices
~10
(via 98, 201)
- `` -
7
3
0.001
10
800
E/F loop
~50
CAL
8
2a
0.008
40
700
F/G loop,
~70
B' helix (via 193)
1 The length of the REMD trajectories (given in table 1) is
approximate and
longer than the length of the trajectories shown with MolSurfer
(listed in table 2).
protein
traj#
pw#
rmin/
N
k/
expulsion
traj.
+
route
length1/
ligand
Å
(kJ/mol
![]() nm)
nm)(residue#)
ps
P450cam
CAM
9
1
0.02
100
600
C' helix, G/H loop
15.8
3
2a
0.002
10
800
F/G loop,
11.2
B' helix (via 87)
6
2c
0.008
40
700
B', I and G helices
7.4
(via 98, 201)
7
3
0.001
10
800
E/F loop
~50
only last 25.2ps shown
Conclusions
With the REMD method, three major ligand exit pathways were found in
P450cam and one in P450BM-3.
Both P450 proteins have pathway 2a in common.
This is the pathway that has been proposed on the basis of
crystallographic and site-directed mutagenesis data and we have
computed
it to be the most probable pathway for substrate exit from P450cam
by
steered
MD and adiabatic mapping techniques. To facilitate understanding
and
investigation of the ligand exit pathways
identified in the molecular dynamics simulations, we have here
presented
two visualization tools. With Molsurfer, the center of mass traces of
the ligand along different expulsion pathways in P450cam can be
viewed
interactively along with various properties of the trajectory. In the
animations, transient conformational changes in the proteins can be
identified and compared for the different substrate trajectories and
proteins. These two tools together help to gain a better understanding
of
the mechanisms by which substrate may access and products may exit
the active site cavities of P450cam and P450BM-3.
Acknowledgments
We thank T. P. Straatsma for providing us with the ARGOS program
and for helping us with technical problems.
This work was partially supported by the
EU Biotechnology Programme (BIO2-CT94-2060).
S.K.L aknowledges an Erwin-Schrödinger Fellowship granted
by the Austrian Fonds zur Förderung der Wissenschaftlichen
Forschung (JO1379-CHE)
and a Marie-Curie Fellowship by the EC (BIO4-CT97-5036).
Privacy Imprint
